Author

admin

Browsing

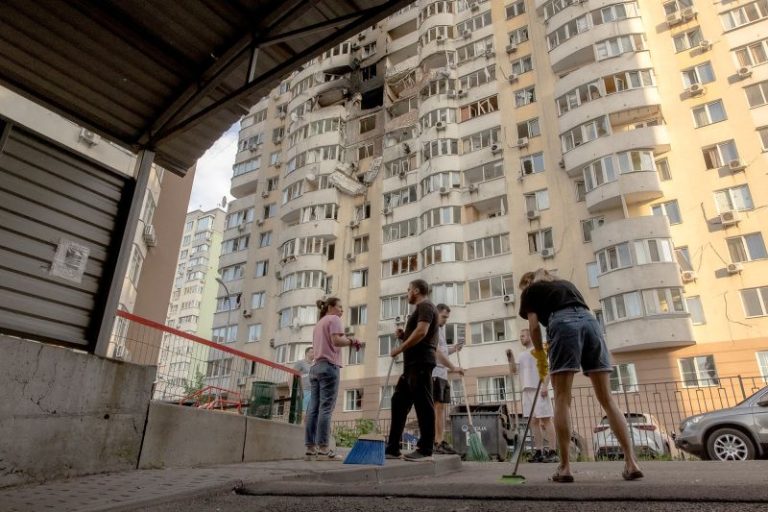
On a recent evening in Kyiv, 4-year-old Olexander Reshetnik made a simple suggestion to his parents: “Let’s go to the parking garage now so we can sleep properly, and you don’t have to wake us up twice to take us there and back.”

The family lives on the 18th floor of a high-rise building and getting into the underground garage that doubles as a bomb shelter during Russian attacks is an uncomfortable experience. With aerial attacks becoming more common, it made sense to Oleksander to simply stay there.

Even at his young age, he knew the Russians would likely attack again.

His mother Khrystyna Reshetnik said the family has gotten used to seeing drones being shot down in the skies over Ukraine’s capital. In days gone by there would be one or two, maybe three, but things have changed.

Russia has ramped up its airborne attacks against Ukraine in recent weeks, launching as many as 479 drones and missiles in a single night. These assaults are not just bigger and more frequent; they are also more concentrated and executed in a way that makes them a lot more difficult to combat – as they are flown at higher altitudes, out of reach of machine guns.

Russia ramps up drone production

Russia successfully scaled up the domestic production of its most frequently used drone – the Iranian-designed Shahed – last fall and is now churning out hundreds of these killing machines every day.

Christina Harward, a Russia analyst at the Institute for the Study of War, said that according to current estimates, Moscow can now produce about 2,700 Shahed drones per month, as well as some 2,500 decoy drones.

The fact that some of the drones are decoys makes little difference to the Ukrainian defenses as Moscow has adapted them in a way that makes it very difficult to distinguish them from the real thing.

“So, either Ukrainian forces spend time trying to identify the decoys or they spend precious resources shooting them down. Either way, this helps the Russian missiles and Shaheds – with their large payloads – (as they) have the chance to get through to their targets,” Harward said.

The increased number of drones launched each night is overwhelming Ukrainian air defenses, especially since Russia began to zero in on handful of locations at a time.

On Monday night, it targeted the Ukrainian capital and the Black Sea port city of Odesa. The following night, it was Kharkiv, Ukraine’s second-largest city.

Russia maintains that it does not target civilians, but evidence to the contrary continues to mount. At least 154 Ukrainian civilians – including children – have been killed by drones, in Russian missile assaults and by artillery across the country in the last four weeks. A further 900 civilians have been injured.

The deadly attacks are designed to undermine Ukrainian morale and create the illusion that Russia has the upper hand in the war – even though Moscow is far from “winning.”

The front line in Ukraine has not moved in any significant way since Ukrainian forces liberated the southern city of Kherson in November 2023.

Russia has only managed to seize about 5,000 square kilometers (1,900 square miles) of Ukraine’s territory since then. Russian troops have advanced in some areas in eastern and northern Ukraine in recent months but have not managed to break through or take over a major city.

‘Impossible to shoot them down’

Yuriy Chumak spends many of his nights perched on Kyiv’s rooftops, machine gun in hand. A Supreme Court judge by day, he is part of a volunteer drone-hunting unit by night. He said the skies have gotten significantly busier in recent weeks.

He said after Moscow started flying drones at higher altitudes, it has become much harder, if not impossible, for his unit to destroy them.

Previously, Russian forces would fly the drones low, for example along a riverbed, to avoid being detected by Ukraine’s air defenses for as long as possible.

“The time to respond was very short because we only detected it when it was (close),” he said.

These days, he said, Russian drones are flying two to five kilometers (1 to 3 miles) above the ground.

“We can see them all. Radars can track them. But it has become impossible to shoot them down with machine guns,” Chumak said, adding that Ukraine now has to use missiles to thwart them.

But missiles are in much shorter supply. This is pushing Ukrainian forces to find new solutions on the go. Melnyk said that the efficiency of Ukraine’s air defense system remains remarkable. “Even now, about 80% of drones are being intercepted. A few months ago, this percentage was about 95. (But) we can see the impact of Russia increasing the number (of drones) and changing tactics,” he added.

Speaking to reporters last month, Ukraine’s President Volodymyr Zelensky praised the Ukrainian Air Force and volunteers like Chumak for pivoting as Russia ramped up its air war.

He added that Kyiv was now using drone-to-drone interceptors to combat the higher altitude bombardment. “We have the technology. The question is when we will be able to expand,” he said.

Zelensky said that Russia can produce some 300 to 350 drones a day, while Ukraine can only make 100.

“The issue is no longer about production capacity. It’s financial,” he said.

‘The norm for our children’

Kyiv mom Khrystyna Reshetnik said one of the worst things about the Russian aerial assaults is that they have become commonplace to her three boys, aged 4, 8 and 11. Olexander regularly asks whether the noise he hears is a Kalibr cruise missile or a drone.

“He’s just a little boy and he already understands what’s going on,” Reshetnik said. As the attacks have intensified in size and scope, the family has been spending more time in the underground parking garage, where Olexander and his two brothers sleep in the trunk of their car.

“This has become the norm for our children. It hurts my heart,” she said.

Yet despite the daily horrors they experience, the Reshetniks are among the lucky ones. They live in Kyiv, a city that is relatively well defended. The majority of the explosions they hear are Ukrainian air defenses intercepting Russian drones.

Many others elsewhere around the country are left without protective shields because Ukraine’s access to air defenses is limited by what its Western allies are willing to spare. Closer to the front lines, Russian troops have been using smaller drones to target civilians.

“There is (a) ballistic missile coming, so I am going to go into the shelter. My point is that this is the daily life of Ukrainian citizens and civilians.”

This post appeared first on cnn.com

French President Emmanuel Macron is due to land in Greenland Sunday, in a move designed to bolster European support for the Danish territory, which is still batting away advances from the Trump administration to acquire it for the United States.

Macron will be the first foreign leader to visit the resource-rich island since US President Donald Trump began his campaign to buy or annex Greenland, which he insists the US needs for national security purposes.

A source at the Élysée Palace said that the French president’s trip had a “dimension of European solidarity and one of strengthening sovereignty and territorial integrity,” without mentioning the Trump administration’s threats to purchase Greenland, or take it by force.

Additionally, Macron’s visit would focus on Arctic security, climate change and Greenland’s economic development, the source added.

During his time on the world’s biggest island the French leader will tour a glacier, a hydroelectric power station and a Danish warship moored near the semiautonomous territory’s capital, Nuuk, per the Élysée.

“The deeps are not for sale, any more than Greenland is for sale, any more than Antarctica or the high seas are for sale,” Macron said on June 9 as he opened a United Nations conference on the oceans in Nice, France.

Trump’s intentions for Greenland can’t be far from the French president’s thoughts on his first visit to the Arctic territory, which Macron will conduct alongside Danish Prime Minister Mette Frederiksen and Greenland’s political leader, Jens-Frederik Nielsen.

French Foreign Minister Jean-Noel Barrot said in January that Paris had “started discussing (the deployment of French troops) with Denmark,” but that Copenhagen did not want to proceed with the idea.

Trump has repeatedly expressed interest in buying the island, or the US taking it by military or economic coercion, even as NATO ally Denmark and Greenland have firmly rejected the idea. Last month, the US president renewed his threat of using military force to annex the territory.

US Vice President JD Vance also made a stopover to visit American troops in Greenland in late March. During that trip, the vice president made a high-profile case for US control of the island. He said Greenland would be better off “coming under the United States’ security umbrella than you have been under Denmark’s security umbrella.”

In a move widely seen as an effort to ease American ambitions for the territory, on June 12 Denmark’s parliament widened a military agreement with Washington to allow US bases on Danish soil. US soldiers had previously been based at Danish facilities.

Denmark is also moving to bolster its military presence in Greenland, some 1,500 miles from the Danish mainland, including with fighter jets to patrol the western coastline toward the US and a navy frigate, per Greenland’s parliament.

This post appeared first on cnn.com

U.S. President Donald Trump said on Friday that concerns over national security risks posed by Nippon Steel’s $14.9 billion bid for U.S. Steel can be resolved if the companies fulfill certain conditions that his administration has laid out, paving the way for the deal’s approval.

Shares of U.S. Steel rose 3.5% on the news in after-the-bell trading as investors bet the deal was close to done. Trump, in an executive order, said conditions for resolving the national security concerns would be laid out in an agreement, without providing details. “I additionally find that the threatened impairment to the national security of the United States arising as a result of the Proposed Transaction can be adequately mitigated if the conditions set forth in section 3 of this order are met,” Trump said in the order, which was released by the White House.

The companies thanked Trump in a news release, saying the agreement includes $11 billion in new investments to be made by 2028 and governance commitments including a golden share to be issued to the U.S. government. They did not detail how much control the golden share would give the U.S. Shares of U.S. Steel had dipped earlier on Friday after a Nippon Steel executive told the Japanese Nikkei newspaper that its planned takeover of U.S. Steel required “a degree of management freedom” to go ahead after Trump earlier had said the U.S. would be in control with a golden share.

The bid, first announced by Nippon Steel in December 2023, has faced opposition from the start. Both Democratic former President Joe Biden and Trump, a Republican, asserted last year that U.S. Steel should remain U.S.-owned, as they sought to woo voters ahead of the presidential election in Pennsylvania, where the company is headquartered.

Biden in January, shortly before leaving office, blocked the deal on national security grounds, prompting lawsuits by the companies, which argued the national security review they received was biased. The Biden White House disputed the charge.

The steel companies saw a new opportunity in the Trump administration, which began on January 20 and opened a fresh 45-day national security review into the proposed merger in April.

But Trump’s public comments, ranging from welcoming a simple “investment” in U.S. Steel by the Japanese firm to floating a minority stake for Nippon Steel, spurred confusion.

At a rally in Pennsylvania on May 30, Trump lauded an agreement between the companies and said Nippon Steel would make a “great partner” for U.S. Steel. But he later told reporters the deal still lacked his final approval, leaving unresolved whether he would allow Nippon Steel to take ownership.

Nippon Steel and the Trump administration asked a U.S. appeals court on June 5 for an eight-day extension of a pause in litigation to give them more time to reach a deal for the Japanese firm. The pause expires Friday, but could be extended.

June 18 is the expiration date of the current acquisition contract between Nippon Steel and U.S. Steel, but the firms could agree to postpone that date

This post appeared first on NBC NEWS

Catching a sector early as it rotates out of a slump is one of the more reliable ways to get ahead of an emerging trend. You just have to make sure the rotation has enough strength to follow through.

On Thursday morning, as the markets maintained a cautiously bullish tone, I checked the New Highs panel on the StockCharts Dashboard, scanning the 1-, 3-, 6-, and 9-month highs list. A clear theme emerged—biotech and healthcare stocks dominated the shorter-term highs.

Seeing strength in healthcare and biotech, I checked the Market Summary BPI panel to compare breadth across sectors. Healthcare posted a 63.93% reading—an early sign the sector may be turning higher.

Comparing the broader sector with the biotech industry, the Key Ratios – Offense vs. Defense panel showed that Biotech outperformed Healthcare by a modest 2.31% over the past three months. This panel compares the SPDR S&P Biotech ETF (XBI), which represents the biotech sector, with the broader Health Care Select Sector SPDR Fund (XLV).

Are Biotech and Healthcare Starting a Bullish Rotation?

So, are we seeing an early rotation of both industry and sector toward the upside, and could either be shaping up as an opportunity for investment? Let’s take a comparative look at both relative to the SPDR S&P 500 ETF (SPY), our broad market stand-in.

Comparing XBI and XLV to SPY: Signs of Leadership?

FIGURE 1. PERFCHARTS OF XBI, XLV, AND SPY. This is typical of what you’d see during an early-stage rotation.

This PerfCharts view shows a one-year snapshot of relative performance, with biotech lagging behind healthcare, and both trailing the SPY in negative territory. Yet XBI and XLV are showing signs of recovery, with XBI exhibiting a sharper angle of ascent.

Seasonal Strength in Healthcare and Biotech Stocks

Now here’s an interesting addition to the current analysis: what if we considered the industry and the sector from a seasonality perspective? The reason for this is that certain sectors and the industries within them tend to exhibit recurring patterns of strength or weakness during specific times of the year. If we’re seeing a potential turning point in either, could a seasonality lens offer additional insight or clarity to the analysis?

Biotech Seasonality: Strong Months for XBI

Let’s start with XBI, and notice how it’s now entering a cluster of seasonally-favorable months.

FIGURE 2. SEASONALITY CHART OF XBI. The industry is entering a cluster of seasonally strong months.

According to this 10-year seasonality chart, June, July, August, and November tend to be strong months for XBI, with positive closing rates well above 50% (see figures above each bar) and higher-than-average returns (see figures at the bottom of the bars). Among them, June and November stand out as XBI’s strongest seasonal months.

XLV Seasonality: November Still Reigns

FIGURE 3. SEASONALITY CHART OF XLV.  According to this, July is XLV’s second-strongest month after November.

XLV’s seasonal profile shares a similar pattern, with a few key differences. July emerges as XLV’s second-strongest month, boasting a close rate of 89% and an average return of 3.1%. Like XBI, November is XLV’s top month in terms of average return.

What this tells us is that the biotech industry and the broader healthcare sector have historically performed well during these periods (especially November), suggesting that seasonal strength could serve as a tailwind if the current rotation continues to build momentum.

Charting the Rotation: XBI Trend Structure Shows Some Clarity

Next, let’s take a look at their current price action, starting with a daily chart of XBI.

FIGURE 4. DAILY CHART OF XBI. Notice how the trend structure is well-defined by the Fibonacci retracement, providing clear measurements for you to gauge the subsequent directionality once the market decides which way XBI will go.

XBI’s price action shows it reversed at the 50% Fibonacci Retracement level (November high to April low). Will the bears take control, or will XBI’s near-term reaction strengthen into an uptrend, eventually pushing XBI past the 61.8% retracement level, a threshold wherein bears may fold their positions and bulls increase theirs?

In light of the latter, the Relative Strength Index (RSI) is at 61 and rising, indicating room for upside, but only under the condition that the current bullish swing maintains its trajectory.

A few actionable tips. If you’re bullish on XBI and planning to add it to your portfolio, consider the following:

  • If XBI were to pull back deeper, watch to see if it bounces near the last recent swing low area at $76.
  • If XBI reverses to the upside, expect resistance at the 61.8% Fib retracement at around $91. Also, watch the yellow-shaded zone around $94, an area of concentrated trading activity which may also act as a strong resistance zone.

If XBI rotates in a bullish fashion, these key levels can help guide your analysis.

XLV Technical Setup: Strength, But Not Yet a Breakout

Next, shift over to a daily chart of XLV. You’ll notice it’s quite different despite also exhibiting a recovery.

FIGURE 5. DAILY CHART OF XLV. Unlike the previous example, XLV’s price action is more muddled.

XLV’s recovery doesn’t appear as convincing just yet, as it still needs to clear multiple swing highs and resistance levels clustered between $139 and $141 (highlighted in green). If it manages to break above this zone, the next resistance range—shaded in yellow—sits between $148 and $150. In short, the sector proxy faces several hurdles and technical headwinds ahead.

The RSI, at 58 and rising, is nowhere near overbought territory, but it may not immediately indicate bullishness unless XLV is able to establish an uptrend. For now, it isn’t clear if that will happen, so exercise caution.

From an actionable standpoint, the current technical structure doesn’t offer a clear entry setup. That’s largely because the trend lacks a well-defined sequence of higher swing highs and higher swing lows—something you’d typically look for when establishing favorable entry and exit positions.

At the Close

If healthcare and biotech are starting to rotate higher, XBI and XLV are the charts to watch. XBI shows a stronger trend structure, while XLV still faces resistance.  With seasonality on their side, add them to your ChartLists to track key levels and price action.


Disclaimer: This blog is for educational purposes only and should not be construed as financial advice. The ideas and strategies should never be used without first assessing your own personal and financial situation, or without consulting a financial professional.

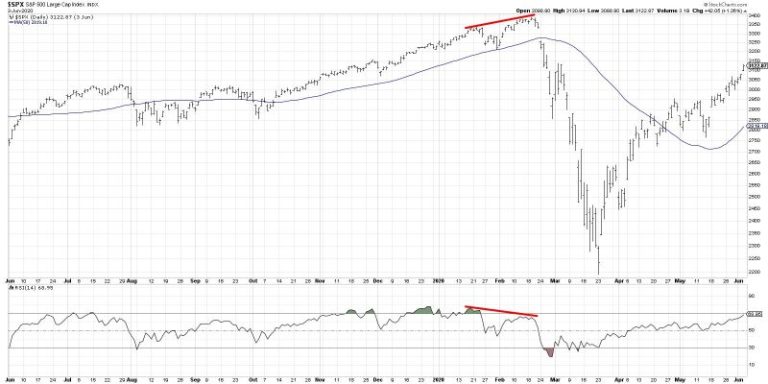
With Friday’s pullback after a relatively strong week, the S&P 500 chart appears to be flashing a rare but powerful signal that is quite common at major market tops. The signal in question is a bearish momentum divergence, formed by a pattern of higher highs in price combined with lower peaks in momentum, which indicates weakening buying power after an extended bullish phase.

Today, we’ll share a brief history lesson of previous market tops starting with the COVID peak in 2020. And while we don’t necessarily see a sudden downdraft as the most likely outcome, this bearish price and momentum structure suggests limited upside for the S&P 500 until and unless this divergence is invalidated.

First, let’s review some classic market tops, see how divergences are formed, and learn what often comes next.

The year 2020 started in a position of strength, continuing the uptrend phase of 2019. But conditions soon deteriorated, with weaker momentum and breadth signals flashing cautionary patterns. In the chart below, we can see the higher highs and higher lows in price action in January and February 2020.

Notice how the RSI was overbought at the January peak but not overbought at the February top? This pattern of higher prices on weaker momentum is what we’re looking for, as it implies a lack of buying power and therefore limited upside.

Almost two years later, the market had been driven higher due to an unprecedented amount of liquidity injected into the financial system. Toward the end of 2021, however, we saw the familiar bearish divergence flash again.

Here, we can see the higher price highs in November 2021 through January 2022 were marked by lower readings on momentum indicators like RSI. It’s worth noting here that these divergences don’t happen in a vacuum. In other words, we can use other tools in the technical analysis toolkit to evaluate the trend and determine if the price is reacting as expected to the bearish divergence.

In the weeks after the 2022 peak, we can see that the price broke down through an ascending 50-day moving average. The RSI eventually broke below the 40 level, confirming the rotation from a bullish phase to a bearish phase. So while the divergence itself does not imply a particular path in the months after the signal, it alerts us to use other indicators to validate and track a subsequent downtrend move.

More recently, the February 2025 market peak featured some classic momentum patterns going into the eventual top.

Starting in August 2024, we can see a series of higher price highs that were accompanied by improving RSI peaks. As the price was moving higher, the stronger momentum readings confirmed the uptrend phase. Then, starting December 2024, the next couple price peaks were marked with weaker momentum readings. This bearish divergence with price and RSI once again signaled waning momentum going into a major market peak.

That brings us to the current S&P 500 chart, featuring yet another bearish momentum divergence. And based on what we’ve reviewed so far, you can probably understand why I’m a bit skeptical going into next week!

To be fair, I’ve highlighted price and momentum divergences from significant market tops, many of which came after extended bull market phases. In this case, we’re still only two months off a major market low. However, I would argue the basic premise still holds true. With Friday’s pullback, the S&P 500 appears to be flashing this same pattern of higher prices on weaker momentum. Considering this negative rotation on momentum, I would anticipate at least a retest of the May swing low around 5770.

What would change this tactical bearish expectation? The only way for a bearish divergence to be negated is for the price to continue higher on stronger momentum. So, until we see the price make a new peak combined with the RSI pushing back up to overbought levels, a pullback may be the most likely scenario in the coming weeks.

RR#6,

Dave

P.S. Ready to upgrade your investment process? Check out my free behavioral investing course!


David Keller, CMT

President and Chief Strategist

Sierra Alpha Research LLC

marketmisbehavior.com

https://www.youtube.com/c/MarketMisbehavior


Disclaimer: This blog is for educational purposes only and should not be construed as financial advice. The ideas and strategies should never be used without first assessing your own personal and financial situation, or without consulting a financial professional.

The author does not have a position in mentioned securities at the time of publication. Any opinions expressed herein are solely those of the author and do not in any way represent the views or opinions of any other person or entity.

Investor Insight

A Canadian exploration company poised for discovery, Bold Ventures is focused on the exploration and development of high-potential precious and battery minerals projects in tier 1 jurisdictions in Canada.

Overview

Bold Ventures (TSXV:BOL) is a Canadian mineral exploration company focusing on battery, critical and precious metals located in Northern Ontario and Quebec. The company’s asset portfolio demonstrates its focus on these commodities to create consistent value with gold and meet the growing demand for battery and critical metals.

Bold Ventures’ key projects are located within three active regions throughout Ontario: Thunder Bay West, Wawa West and the Ring of Fire camp located in the James Bay Lowlands. The Thunder Bay properties host gold and copper mineralization, while the Wawa and Ring of Fire properties have copper, gold, and chromium mineralization with additional potential for zinc, nickel, silver and PGE mineralization. The newly added Springpole East gold and Joutel gold and base metal projects expand Bold’s footprint into additional high-potential areas.

The Burchell gold and copper project, west of Thunder Bay, is Bold’s flagship property with a newly discovered high-grade gold occurrence as well as historical drill intersections of highly anomalous gold and copper. The project is ideally positioned next to Goldshore Resources Inc.’s Moss Gold Project hosting the Moss Gold Deposit of nearly 6 million ounces of gold in the indicated and inferred resource categories.

The 100 percent owned Traxxin gold project, west of Thunder Bay, has shown numerous high-grade gold intersections in drilling. The project is a joint venture between Bold Ventures, as the operator, and Lac des Mille Lacs First Nation, where the joint venture can earn up to 100 percent of the property.

An experienced team of explorers leads the company toward fully realizing the potential of its portfolio. The company’s leadership team has participated in three significant world-class discoveries, including:

  • Eagle River Mine: Discovered in 1987 by Central Crude/Noranda and has produced over 1 million ounces (Moz) of gold.
  • Windfall Lake: Discovered by Noront circa 2006, currently owned by Osisko (purchased by Goldfields for $2.16B), it contains 4.1 Moz @ 11.4 grams per ton (g/t) gold indicated and 3.3 Moz gold @ 8.4 g/t gold inferred for a total of 7.4 Moz gold in all categories.
  • Ring of Fire Deposits: Discovered in 2007 and contain multiple significant deposits including Eagle’s Nest, Eagle Two and Blue Jay (AT-12) Nickel-Copper Massive Sulphide Deposits, Blackbird Chromite Deposit and Thunderbird Vanadium Occurrence.

This wealth of experience allows Bold Ventures to strategically acquire undervalued assets and apply sophisticated exploration techniques to identify significant mineral deposits.

Company Highlights

  • Bold Ventures is a Canadian mineral exploration company focused on exploring and developing its precious and critical mineral projects in Northern Ontario.
  • The company owns and operates several projects throughout three key regions of Ontario: Thunder Bay West, Wawa West and the James Bay Lowlands-Ring of Fire.
  • The company has been advancing its copper and gold projects to the drill stage.
  • The Burchell gold and copper project is located 100 km west of Thunder Bay and enjoys major road access, rail, power, and an experienced mineral exploration workforce and mining supply located within hours of the property. The project hosts the newly discovered (Nov 2024) 111 Gold Zone as well as historical gold anomalies on surface and drill core along strike from the Moss Deposit to the west, owned by Goldshore Resources Inc.
  • The Traxxin gold project is located 130 km west of Thunder Bay and is similarly accessible. It boasts the Company’s best gold intersection in drill core which is hosted in a similar geological setting to Agnico Eagle’s Hammond Reef Gold Deposit in the district.
  • The Koper Lake project is located within 300 meters of Ring of Fire Metals’ (formerly Wyloo/Noront) flagship Eagle’s Nest Nickel-Copper deposit. It hosts a large chromite resource and attractive nickel potential.
  • Bold Ventures continues to expand its portfolio with two promising new acquisitions – the Springpole East gold project in Ontario and Joutel gold and base metals projects in Quebec – both strategically positioned in established mining districts.
  • Bold Ventures’ management team has decades of experience within the mining sector. The management and technical teams have participated in three world-class discoveries and have the right experience to guide the company toward its goals.

Key Projects

Burchell Gold and Battery Metals Project

The Burchell claim group covers 4,607 hectares (11,384 acres) comprising 242 claims and is located 100 kilometers west of the port city of Thunder Bay in Northwestern Ontario. The project is road-accessible south of the Trans-Canada Highway 11.

Project Highlights:

  • Located in the Western Shebandowan Greenstone Belt: The Burchell project is located on this high-potential, active mineral belt and contains copper, gold, silver, nickel, zinc, molybdenum and other minerals.
  • Contiguous with Significant Gold Property: The Burchell property is contiguous with Goldshore Resources’ Moss gold project. The Moss Lake gold deposit lies within a major 25 km NE-trending structural corridor which also hosts the past-producing North Coldstream Mine and the East Coldstream gold deposit. Approximately 1.8 km of this mineralized trend lies in the NW corner of the Burchell property, hosting historical gold occurrences.
  • New Discovery (November 2024): A new zone called ‘111 Zone’ was discovered in the center of the property, situated within a prominent magnetic low. Samples ranged from 10 ppb gold to 68 g/t gold in sheared, silicified, sericitized volcanic rocks. Historical trenches along strike to SW of 111 Zone in SW corner of property yielded rock samples up to 42 g/t gold. Historical Newmont drilling in the NW corner of the property returned 0.9 g/t gold over 6.4 m.
  • Recent MMI Samples (November 2024): Soil samples in the NW corner of the property, along strike from the Moss Trend, returned high response ratios for gold (up to 40), copper (up to 61), molybdenum (up to 369), zinc (up to 93), and uranium (up to 52). Several samples in the northern half of the survey showed coincident gold, copper, molybdenum response ratios >10.
  • Hermia Lake Copper-Gold Prospect: This prospect extends for 2.8 km along a northeast trend. Historical diamond drilling includes intercepts of 0.8 percent copper over 4.3 m (Great Lake Copper Mines in 1956), 0.25 percent copper over 51.9 m (Gulf Minerals in 1981), and 1.4 g/t gold over 7.2 m (Mengold in 2008).

Traxxin Gold Project

The 100 percent owned Traxxin gold project is 130 km west of Thunder Bay and has 209 claims covering 3,885 hectares (9,600 acres). The project has excellent existing infrastructure and is road-accessible, located between two major highways, cutting down on future development costs.

Project Highlights:

  • Close Proximity to Significant Gold Deposit: The project is 40 km east of Agnico Eagle’s Hammond Reef deposit, which contains 5.6 Moz of gold at 0.71 g/t, including reserves, measured and indicated.
  • Promising New and Historical Exploration Results: Bold Ventures’ 2021 drill hole campaign results indicated 3.57 g/t gold over 12.29 meters, including 6.13 g/t gold over 4.88 m. Additional historical results include:
    • Grab samples 1281, 152, 116, 21.1 and 3.73 g/t gold
    • Five historical drill holes with greater than 5 g/t gold over various intervals
    • One historical drill hole greater than 37 g/t gold over 1 meter
  • Exploration Campaigns: Trenching at the Main Zone and Tear Drop Lake in 2021 returned channel samples up to 9.08 g/t gold. In 2024, shoreline prospecting on Bedivere Lake yielded gold values up to 345 (parts per billion (ppb)) gold on an island northeast of Traxxin Main Zone.
  • The gold bearing shear zone remains open in all directions with potential for extending the Main Zone to the north via geophysics and exploring the southern extension.

Farwell Gold-Copper Project

The Farwell project covers 6,440 hectares (15,914 acres) comprising 133 claims. The property is located in the Lake Superior east region of Northeastern Ontario, approximately 55 km northwest of Wawa, and in a proven gold camp.

Project Highlights:

  • Promising Geological Formations: The claim group hosts gold-bearing quartz veins located within an iron formation that stretches along the western extensions of a major deformation zone. Additionally, there is base metal volcanogenic massive sulphide (VMS) style mineralization of copper, zinc, lead and silver. The property also features deformed ‘Timiskaming’ style conglomerates along the gold mineralizing trend (similar to Kirkland Lake, Geraldton).
  • Exploration Highlights and Future Drill Targets: A versatile time domain electromagnetic (VTEM) survey has identified multiple anomalous areas for future drilling. Additional results and interpretation were incorporated into the existing database for future exploration and, ultimately, for drill testing. The company completed geophysical modelling of six high priority electromagnetic conductors identified by a helicopter-borne, VTEM and magnetic survey.
  • Road-accessible: The claim group is accessible via the Eagle River gold mines haulage road and is located approximately 6 km from the Eagle River Mill complex that also connects to major highways suitable for future material transportation.

Wilcorp Gold Project

The Wilcorp gold project covers 264 hectares (652 acres) and consists of four patented claims, 15 single cell and three boundary cell mining claims. The asset is 17 kilometers south of Agnico Eagle’s Hammond Reef Deposit and 32 kilometers west of Traxxin, within the Thunder Bay Mining Division. New drill targets have been identified for follow-up exploration.

Project Highlights:

  • Historical Results: The ‘Eagle Prospect’ area has significant historical gold discoveries. Maps from 1946 indicate values up to 11.1 g/t gold over 4.1 m including 30.8 g/t gold over 0.8 m in core (unsubstantiated in the modern era). Recent values include up to 16.3 g/t gold in an area where 1990s drilling returned 1.8 g/t gold over 7.6 m.
  • Sampling Results: In 2012, 62 grab samples ranged from <5 ppb gold up to 14,403 ppb gold (14.4 g/t gold), and in 2024, 39 grab samples ranged from <5 ppb gold up to 16,300 ppb gold (16.3 g/t gold).
  • Induced Polarization (IP) Surveys: A 2012 IP survey identified several trends that are targets for exploration.
  • Geological Setting: The property is proximal to the Quetico Fault, a major east-west fault zone. Gold mineralization is hosted in shear zones in volcanic and dioritic rocks which are subparallel to the Quetico Fault.

Significant Historical Work: The property has pre-existing historical work, including stripping, trenching and diamond drilling which identified significant gold zones.

Koper Lake Project (Ring of Fire)

Project Highlights:

  • Multiple Commodity Streams: The Koper Lake project has significant potential for critical minerals. The property has the potential to develop battery metals, chromite and precious metals for multiple revenue streams.
  • Within the Koper Lake project, the Black Horse Chromite Deposit contains an NI 43-101 inferred resource of 85.9 MT at a grade of 34.5 percent chromium (III) oxide (Cr2O3) using a cutoff grade of 20 percent Cr2O3.
    • Black Horse Chromite Ownership Interests:
      • Bold 10 percent carried interest (through to production), KWG 90 percent working interest
  • All Other Metals (Green and Battery Metals including Nickel, Copper, PGEs; Precious Metals including Gold and Silver) Ownership Interests:
    • Bold 40 percent working interest, KWG 60 percent working interest
    • Bold has option to earn up to 80 percent working interest leaving KWG with a 20 percent working interest

The asset comprises 1,024 hectares and is located less than 300 meters from Ring of Fire Metals’ (formerly Noront Resources) Eagle’s Nest Nickel-copper massive sulphide deposit, which is in the permit stage.

Ring of Fire Claims

The Ring of Fire asset is a future key project that will be given further attention as the Ring of Fire regional infrastructure and First Nation agreements are developed.

Project Highlights:

  • The Ring of Fire Claims project is a grassroots exploration project that has significant potential targeting the battery metals nickel, copper and platinum group elements.
  • Bold carried out a VTEM airborne survey in 2013 that located numerous geophysical anomalies that are prospective for battery metals.
  • Further exploration is pending the development of access, infrastructure and First Nation agreements.

In June 2024, Bold Ventures signed an agreement to option a 100 percent interest in two claim groups out of the 14 claim groups within the Ring of Fire region to an arm’s-length party. The two claim groups total 1,050 hectares and comprise approximately 90 claim units. The option agreement includes aggregate cash payments totaling C$135,000 and aggregate exploration expenditures of C$250,000 over a four-year period. The deal also includes a 3 percent net smelter royalty for Bold, after the optionee earns a 100 percent interest by fulfilling the terms of the agreement.

Springpole East Gold Project

The Springpole East gold project is one of Bold Ventures’ newest project acquisitions strategically positioned in an established mining district. This property covers 4,180 hectares across 208 single cell claims in northwestern Ontario, located just 120 km east-northeast of Red Lake and merely 9 km east of First Mining Gold’s substantial Springpole gold deposit (containing 4.6 Moz of gold at 0.94 g/t in the indicated category and an additional 0.3 Moz at 0.54 g/t in the inferred category). The project shares a boundary with First Mining’s land package, positioning it within a proven gold-bearing geological trend.

Despite its promising location, Springpole East has seen relatively limited systematic exploration. The most recent work in 2022 by GoldON Resources included high-resolution airborne magnetic surveys and prospecting that yielded encouraging results, including the discovery of altered granitic boulders with gold values ranging from 191 to 1,270 ppb. Of particular interest is the nearby Canamer or Birch Lake East Occurrence just 1.3 km west of the property boundary, where First Mining reported impressive grab samples yielding 15.3 g/t gold in 2022. This showing occurs in banded iron formation – a rock type that has been mapped in the northwest portion of Springpole East and corresponds with prominent magnetic anomalies identified during previous surveys.

Joutel Gold and Base Metal Project

Complementing its Ontario-based acquisition, Bold has also added the Joutel gold and base metal project in Quebec to its exploration portfolio. Located 140 km northwest of Val d’Or with favorable logging road access, this property comprises 41 claims across two claim groups covering 2,269 hectares. Bold is already familiar with the area, having conducted airborne VTEM and magnetic surveys in 2012, identifying several anomalies that remain underexplored.

The Joutel project sits in a historically productive mining region, just 6.5 km south-southeast of the former mining town of Joutel in Poirier Township. Its strategic location places it within 12 km of the past-producing Joutel gold mine and less than 10 km from previous base metal operations. A particular point of interest is its proximity (6 km) to the Explo-Zinc deposit, which hosts a 2006 mineral resource estimate of 588,000 tons grading 7.63 percent zinc and 0.35 percent copper in the indicated category, plus 273,000 tons at 6.64 percent zinc and 0.21 percent copper in the inferred category.

Historical drilling of VTEM anomalies in the area has produced encouraging results, including intersections of 0.83 percent nickel over 3.7 meters (including a higher-grade section of 1.27 percent nickel over 2.3 meters) and 0.51 g/t gold over 3.05 meters. These results highlight the property’s polymetallic potential, with Bold targeting nickel, gold, silver, copper and zinc mineralization.

Management Team

David Graham – Chief Executive Officer and Director

David Graham has been active in the mineral exploration industry for over 40 years. Between 1997 and 2004 he was co-founder, president and CEO of Normiska Corporation, an industrial minerals and materials company with four production facilities in Canada and the United States.

Between 2006 and 2010 he was a director and vice-president of Noront Resources. During this time the company made major discoveries at Windfall Lake in Urban Twp., Quebec and the Ring of Fire in the James Bay Lowlands of Ontario. From 2010 until 2017 he was executive vice-president of Bold Ventures Inc. at which time, he was appointed president and CEO.

Mr. Graham has worked extensively in Canada as well as in the United States, Scandinavia and Africa. His experience has frequently included working with First Nations and regulatory agencies on projects that ranged from a grassroots stage to advanced development. He is a member of the discovery team for Eagle River, Windfall, and the ‘Ring of Fire’ Noront deposits.

Bruce MacLachlan – President and Chief Operating Officer

With over 40 years of experience in the exploration industry, Bruce MacLachlan is a proven exploration manager and has been a key member of a number of mineral discovery teams, including Eagle River. He has managed a wide range of exploration projects from grassroots through to the post-discovery stage. MacLachlan has been responsible for project presentation, marketing and coordination within the investment space. He has worked with multiple exploration companies, including Noranda Exploration, Battle Mountain Gold and CanAlaska Uranium. He was the exploration manager at Noranda Exploration, Battle Mountain Gold, and CanAlaska Uranium. He is a co-founder and president of Emerald Geological Services (EGS), a consulting company created in 2001.

Coleman Robertson – Vice-president of Exploration

Coleman Robertson is a professional geologist who has worked exploring for gold, base metals and rare earth elements. His experience includes a wide range of exploration activities from grassroots to discovery stage projects. Employed by EGS since 2017, Robertson is vice-president of exploration for EGS and has experience with multiple projects in multiple jurisdictions, including Bold’s gold and copper projects in Northwestern Ontario.

Robert Suttie – Chief Financial Officer

Robert Suttie currently serves as CFO with over 40 years’ experience as a consultant raising capital for emerging companies. He has been a director/executive at several private/public corporations.

William Johnstone – Corporate Secretary and Legal Counsel

William Johnstone is the company’s corporate counsel and corporate secretary. Johnstone has been a partner at Gardiner Roberts LLP since February 2005, practicing in the areas of corporate and securities law for over 40 years.

Ian Bodie-Brown – Director

Ian Bodie-Brown is an industry consultant with over 35 years’ experience. He is chairman of Rio Silver (on the TSX Venture Exchange) and a professional geologist.

Steve Brunelle – Director

Steve Brunelle is a professional geologist with over 35 years’ experience and is the chairman of Rio Silver (on the TSX Venture Exchange).

This post appeared first on investingnews.com

A new report released on Wednesday (June 11) by Canada’s Climate Institute suggests Canada risks missing out on a C$12 billion market for critical minerals should the government not enact policy to drive investment in Canada’s mining sector.

The report outlines a growing need for minerals like copper, cobalt, lithium, nickel, graphite and rare earths, all of which are found in Canada. These critical minerals are all used to produce goods needed for the energy transition, from photovoltaics to electric vehicles.

Overall, to meet this demand, the mining sector will require an estimated US$480 billion to US$750 billion in investment globally. To remain competitive, the institute suggests Canada will need to generate between C$30 billion and $65 billion in investments in upstream projects between now and 2040.

To reduce investor risk and ensure Canada and local communities see a net benefit, the report makes several suggestions aimed at different levels of government.

It recommends the Federal government collaborate with an arms-length financial institution to develop or expand risk-sharing agreements to support mineral assets through price volatility, and provincial governments strengthen mining regulations to mitigate risks and liabilities.

Additionally, it recommends both levels of government facilitate greater participation by Indigenous communities in mining projects through scaling up their resources for capacity and increasing their access to capital.

South of the border, the US Bureau of Labor Statistics released May’s consumer price index (CPI) data on Wednesday. The figures show a worsening of year-over-year inflation as all-items CPI ticked up to 2.4 percent from the 2.3 percent recorded in April. On a monthly basis, it rose just 0.1 percent versus the 0.2 percent the previous month.

Analysts had been expecting a steeper increase, but the numbers were offset by significant declines in energy prices in May.

However, the expectation is that higher figures will be coming over the next few months as the effects of the Trump administration’s tariffs begin to work their way through the economy. The slow response to the tariffs is primarily attributed to retailers working through inventories which were purchased prior to the tariffs coming into effect.

The CPI and other data will play a crucial role in the Federal Open Market Committee’s rate decision when it meets next week, on June 17 and 18. The overwhelming consensus by market watchers is the Fed will continue to hold the current range of 4.25 to 4.5 percent until its September meeting.

Markets and commodities react

In Canada, major indexes were mixed at the end of the week. The S&P/TSX Composite Index (INDEXTSI:OSPTX) was largely flat, posting a small 0.32 percent gain during the week to close at 26,504.35 on Friday. The S&P/TSX Venture Composite Index (INDEXTSI:JX) fared worse, losing 1.16 percent to 721.13, and the CSE Composite Index (CSE:CSECOMP) slid 2.48 percent to 114.88.

US equities were also in negative territory this week, with the S&P 500 (INDEXSP:INX) losing 0.46 percent to close at 6,976.96, the Nasdaq-100 (INDEXNASDAQ:NDX) slipping 0.79 percent to 21,612.68 and the Dow Jones Industrial Average (INDEXDJX:.DJI) sinking 1.38 percent to 42,197.80.

On the other hand, the gold price was up significantly this week, gaining 3.68 percent to US$3,432.17 as investors sought safe-haven assets amid the threat of war between Israel and Iran. The silver price climbed 0.91 percent during the period to end the week US$36.31, although it spiked as high as US$36.86 during trading Monday.

In base metals, the COMEX copper price sank 1.44 percent over the week to US$4.80 per pound. Meanwhile, the S&P GSCI (INDEXSP:SPGSCI) posted a gain of 4.4 percent to close at 568.42.

Top Canadian mining stocks this week

How did mining stocks perform against this backdrop?

Take a look at this week’s five best-performing Canadian mining stocks below.

Stock data for this article was retrieved at 3:30 p.m. EDT on Friday using TradingView’s stock screener. Only companies trading on the TSX, TSXV and CSE with market capitalizations greater than C$10 million are included. Mineral companies within the non-energy minerals, energy minerals, process industry and producer manufacturing sectors were considered.

1. St. Augustine Gold and Copper (TSX: SAU)

Weekly gain: 66.67 percent
Market cap: C$116.31 million
Share price: C$0.125

St. Augustine Gold and Copper is a development company focused on its King-king copper-gold project in the Philippines’ Davao de Oro province. The project consists of 184 mining claims.

According to the most recent preliminary economic assessment from 2013, the company projects an after-tax net present value of US$1.78 billion, with an internal rate of return of 24 percent and a payback period of 2.4 years using a base case scenario of a copper price of US$3.00 per pound and a gold price of US$1,250 per ounce. The company is currently working towards an update to the study.

The most recent news from the project was announced on May 30, when St. Augustine stated that it had entered into an agreement with the National Development Corporation (Nadecor) to acquire a 100 percent interest in Nadecor’s wholly owned subsidiary Kingking Milling, which holds the development rights to King-king. Under the terms of the deal, Nadecor will receive C$9.02 million convertible into 185 million shares.

The project’s exploration and development permits are held by Kingking Mining, which remains a 40/40/20 joint venture between St. Augustine, Nadecor and Queensberry Mining and Development. The release also included details of new ore sales and royalty agreements between Kingking Milling and Kingking Mining.

Shares in St. Augustine rose this week after the company announced Tuesday (June 10) it had entered into a non-brokered private placement for up to 341 million shares for gross proceeds of C$24.9 million.

The company said it will use the proceeds to fund the completion of a feasibility study and organizing financing for the King-king project. The first tranche of the placement is expected to close on June 20.

2. Barksdale Resources (TSXV:BRO)

Weekly gain: 50 percent
Market cap: C$12.88 million
Share price: C$0.105

Barksdale Resources is a copper exploration company focused on advancing its assets in Arizona, US.

The company’s flagship Sunnyside project has been in focus in 2025. The site is located in the Patagonia Mountains of Southern Arizona and covers approximately 21 square kilometers. Sunnyside is located adjacent to South32’s (ASX:S32,OTC Pink:SHTLF) Hermosa project.

The most recent news from the project came on May 13, when the company completed the drilling campaign and expenditures necessary to acquire the initial 51 percent interest in the property as part of an earn-in agreement with Regal Resources. Under the terms, Barksdale was required to complete 7,620 meters of drilling and make C$6 million in total expenditures.

The company has until September 2025 to provide an additional C$1 million in cash payment and 5 million shares to Regal to complete the transaction. Once complete, the company will have 20 days to decide whether to proceed to Phase 2 for the option to increase its interest to 67.5 percent, which it can earn by completing another 7,620 meters of drilling, paying Regal C$550,000 and issuing Regal 4.9 million shares within a two year period.

3. Avalon Advanced Materials (TSXV:AVL)

Weekly gain: 50 percent
Market cap: C$18.91 million
Share price: C$0.03

Avalon Advanced Materials is an exploration and development company focused on lithium projects in Canada.

Its flagship project is its 40 percent owned Separation Rapids lithium project in Ontario, a joint venture with SCR-Sibelco, which owns the remaining 60 percent. The project consists of three primary lithium targets: the Separation Rapids deposit; the Snowbank target, located near Kenora; and the Lilypad project near Fort Hope, which also hosts tantalum and cesium mineralization.

The pair increased the project’s measured and indicated mineral resource by 28 percent in late February.

Although the company didn’t release news this week, its share price jumped significantly during the period.

4. Excellon Resources (TSXV:EXN)

Weekly gain: 48.44 percent
Market cap: C$12.88 million
Share price: C$0.105

Excellon Resources is an exploration and development company working to advance a portfolio of assets around the world.

Its most advanced project is the past-producing Mallay silver mine in Central Peru. The company executed a definitive agreement to acquire the project, as well as the Tres Cerros gold-silver project, in March. Between 2012 and 2018, mining at the site produced 6 million ounces of silver, 45 million pounds of zinc and 35 million pounds of lead before the operation was placed on care and maintenance.

On May 23, Excellon announced it had entered into an offtake and financing agreement with Glencore plc (LON:GLEN) that will provide the final piece of funding to allow Excellon to restart mining operations at Mallay, bringing its available capital to US$18 million.

Under the terms of the agreement, Glencore will provide up to US$7.5 million in funding through a pre-export finance loan agreement backed by concentrate production at the mine. Glencore has also agreed to purchase 100 percent of zinc-lead concentrate until 2028 or 2029 depending on certain conditions.

5. Latin Metals (TSXV:LMS)

Weekly gain: 42.86 percent
Market cap: C$23.77 million
Share price: C$0.20

Latin Metals is a South America focused project generator company with 18 projects across Argentina and Peru.

Its primary focus for 2025 has been on its Argentine portfolio, which includes the Organullo gold project in the Salta province, as well as the Cerro Bayo and La Flora gold projects in the Deseado Massif metal belt in the Santa Cruz province.

The company’s most recent news came on Monday when it announced it had secured drill permits for the Organullo site. The permits provide approval for up to 11,900 meters of diamond drilling as well as other exploration activities. Latin Metals said the permit is a key milestone for the project.

The project is subject to an option agreement with AngloGold Argentina, a subsidiary of AngloGold Ashanti (NYSE:AU), which has the right to earn up to an 80 percent stake in the site. AngloGold is preparing to ‘test targets that have potential scale and alteration characteristics consistent with Tier 1 high-sulphidation epithermal gold systems.’

FAQs for Canadian mining stocks

What is the difference between the TSX and TSXV?

The TSX, or Toronto Stock Exchange, is used by senior companies with larger market caps, and the TSXV, or TSX Venture Exchange, is used by smaller-cap companies. Companies listed on the TSXV can graduate to the senior exchange.

How many mining companies are listed on the TSX and TSXV?

As of February 2025, there were 1,572 companies listed on the TSXV, 905 of which were mining companies. Comparatively, the TSX was home to 1,859 companies, with 181 of those being mining companies.

Together the TSX and TSXV host around 40 percent of the world’s public mining companies.

How much does it cost to list on the TSXV?

There are a variety of different fees that companies must pay to list on the TSXV, and according to the exchange, they can vary based on the transaction’s nature and complexity. The listing fee alone will most likely cost between C$10,000 to C$70,000. Accounting and auditing fees could rack up between C$25,000 and C$100,000, while legal fees are expected to be over C$75,000 and an underwriters’ commission may hit up to 12 percent.

The exchange lists a handful of other fees and expenses companies can expect, including but not limited to security commission and transfer agency fees, investor relations costs and director and officer liability insurance.

These are all just for the initial listing, of course. There are ongoing expenses once companies are trading, such as sustaining fees and additional listing fees, plus the costs associated with filing regular reports.

How do you trade on the TSXV?

Investors can trade on the TSXV the way they would trade stocks on any exchange. This means they can use a stock broker or an individual investment account to buy and sell shares of TSXV-listed companies during the exchange’s trading hours.

Article by Dean Belder; FAQs by Lauren Kelly.

Securities Disclosure: I, Dean Belder, hold no direct investment interest in any company mentioned in this article.

Securities Disclosure: I, Lauren Kelly, hold no direct investment interest in any company mentioned in this article.

This post appeared first on investingnews.com

Former England football captain David Beckham, Oscar-winning actor Gary Oldman and The Who front man Roger Daltrey are among the prominent figures awarded knighthoods in this year’s King’s Birthday Honours list.

Beckham, 50, was recognized for his services to sport and charity. A global soccer icon and former Manchester United midfielder, Beckham has represented England 115 times and clinched league titles across four countries.

He was appointed an officer of the Order of the British Empire (OBE) in 2003 and has since expanded his influence beyond the pitch. He has worked as an ambassador for the worldwide children’s charity UNICEF since 2005 and has been an ambassador for the King’s Foundation since last year.

As a result of his knighthood, his wife, fashion designer and former Spice Girl Victoria Beckham, will now be formally styled Lady Beckham.

Co-founder and lead singer of legendary British rock band The Who, Daltrey, 81, was honored for his services to charity. Alongside his storied musical career, Daltrey has served as a patron of the Teenage Cancer Trust since 2000, spearheading its annual concert series at London’s Royal Albert Hall for more than two decades.

The Who, formed in London in 1964, was inducted into the Rock and Roll Hall of Fame in 1990. Of the band’s four founding members, only Daltrey and guitarist Pete Townshend are still alive.

Oldman, 67, who played Harry Potter’s godfather Sirius Black in several of the movies in the franchise, was awarded a knighthood for services to drama. In 2018, the Hollywood star won an Oscar for his portrayal of Winston Churchill in the film “Darkest Hour.”

Most honors in the UK are awarded twice a year – on the monarch’s official birthday in June, and in the New Year. The list is compiled by the government and signed off by King Charles, with nominations reviewed by independent panels across different sectors.

The most recent New Year Honours list saw knighthoods conferred on actor Stephen Fry, former England soccer manager Gareth Southgate and London mayor Sadiq Khan.

This post appeared first on cnn.com

Authorities were searching Saturday for two Australian gunmen suspected of fatally shooting an Australian tourist and injuring another at a villa on the Indonesian resort island of Bali.

The shooting just after midnight on Friday at Villa Casa Santisya near Munggu Beach in the district of Badung killed Zivan Radmanovic, 32, from Melbourne. The second victim, who is 34 and also from Melbourne was beaten, said Badung Police chief Arif Batubara.

“We cannot yet determine the motive,” Batubara said, adding that an investigation is underway. The two Australians were rushed to hospitals in Denpasar, the provincial capital.

According to police, the villa had only three rooms occupied with a total of five guests when the shooting happened. The two victims’ wives were also there and another foreign tourist, Batubara said.

Radmanovic was shot in a bathroom, where police found 17 bullet casings and two intact bullets.

At least three witnesses at the villa told investigators that two gunmen, one wearing orange jacket with a dark helmet and another wearing a dark green jacket, a black mask and a dark helmet, arrived on a scooter at the villa around midnight.

Radmanovic’s wife, Gourdeas Jazmyn, 30, told police that she suddenly woke up when she heard her husband screaming. She cowered under a blanket when she heard multiple gunshots.

She later found her husband’s body and the injured Australian, whose wife has also testified to seeing the attackers.

The Australian Consulate in Bali has been contacted by authorities and an autopsy for further investigation is still waiting permission from the family of the victim, Batubara said.

This post appeared first on cnn.com

While the S&P 500 ($SPX) logged a negative reversal on Wednesday, the Cboe Volatility Index ($VIX), Wall Street’s fear gauge, logged a positive reversal. This is pretty typical: when the S&P 500 falls, the VIX rises.

Here’s what makes it interesting: the VIX has quietly crept up in three of the last four days. Before the midday pivot, the VIX hit its lowest level since February 21, 2025. And while that wasn’t the low in February, it was close. As the chart below depicts, back then, the VIX’s intraday low occurred on February 14, 2025, a few days before the SPX topped on February 19.

It wasn’t a screaming sell signal for equities. The S&P 500 was set to follow through on the big cup-with-handle pattern breakout, even though two straight bullish patterns failed in December and January.

Ultimately, the combination of the S&P 500 failing to get much higher than 6,100 and the VIX bouncing near support set the stage for the market rolling over. It was, of course, news-induced, but the market’s character had been changing since December, when breadth first took a major hit.

So, with the VIX closer to that same support zone now than it has been at any time the last few months and the S&P 500 back above 6,000, the pendulum has swung back near the extreme levels where the fireworks began. But there are two major differences now vs. then.

Bullish Patterns Are Working

Bullish patterns weren’t holding up well in December, January, and February (and then again in March). But they are working now.

Let’s not take this for granted. The S&P 500 starts the day with three live bullish patterns, and the index already hit one upside objective (5,840).

Most importantly, the index has extended above the breakout zones of the two biggest ones by 5.4% and 9%, respectively (see charts below). This means it could endure a not-so-small drawdown, and the patterns (and their upside targets) would remain in place. The index had no such cushion in February.

Still No 1% Declines

Since April 21, the S&P 500 has logged just one 1% decline, which now spans 35 trading days. It had 20 over the prior 71 days since January 6, 2025. That’s a rate of 2.8% vs. 28%. We had literally 10 times more 1% declines from January to April 21.

We didn’t see too many 1% losses in the first few weeks of 2025 either (see chart below). But with the index continuously failing at resistance, it just couldn’t leverage the low-volatility environment like it did from late 2023 through late 2024. As described above, in the last two months, the S&P 500 has been capitalizing on breakouts on low two-way volatility.

So, could all of this completely flip again with a massively surprising “unknown unknown” headline? There’s always that risk. And we know about the big collection of sell signals out there (MACD and Demark).

All of this suggests a respite is due. Bulls and bears seem to agree about that. What they don’t agree upon is the severity of that next pullback. There’s no use in trying to predict how far or how damaging it will be, however. As long as the bullish patterns remain intact, the nascent uptrend has a chance to continue in the months to come.

Zooming In: ARKK’s Strong Run

Let’s take a closer look at one of the more popular growth-focused ETFs: ARK Innovation ETF (ARKK). Despite finishing off its highs, ARKK logged its fourth straight gain yesterday and is now up eight of the last nine trading sessions. Over that time, it has fully leveraged the bull flag we mentioned two weeks ago. The target from that pattern is near $67.

ARKK also logged its third straight trading box breakout in the last few days. So, from a short-term pattern perspective, things have continued to work for the stock.

Indicator-wise, ARKK is now officially overbought for the first time since last December. Over the last year, here’s how the ETF has fared after first reaching overbought territory.

Last July, ARKK hit its summer top just a few days after becoming overbought. In November and December (while ARKK’s upswing continued through mid-February), the ETF pulled back to levels below where the relative strength index (RSI) first hit 70 over the ensuing days/weeks both times.

In other words, this is not the best trading setup for new short-term longs. We expect the risk-reward to improve after the next pullback.

ARKK is also approaching the upper threshold of its big two-year trading channel, which could slow things down soon.

The Bottom Line

The S&P 500 is rising slowly and steadily, volatility is still relatively low, and growth plays like ARKK are looking strong, although they may be due for a pullback in the near term. Keep an eye on the chart patterns that are forming and look for investment opportunities on pullbacks.